Visit the AVW200 product pages.
Vibrating-wire gages, due to their long-term stability, have been used extensively for measuring environmental, geologic, and civil engineering parameters. Most vibrating-wire sensors include a temperature measuring device so that accurate temperature compensation can be achieved. 
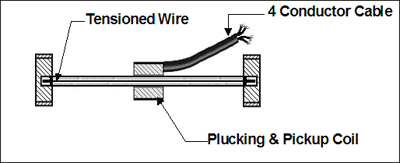
Figure 1. A Vibrating-Wire Sensor
Figure 1 is a depiction of a generic vibrating-wire (VW) sensor. A vibrating-wire sensor operates on the principle that a tensioned wire, when plucked, will vibrate at its resonant frequency. Physical changes to the sensor cause a change in the tension of the wire. An electromagnetic "plucking and pickup" coil strums the wire across a specified frequency spectrum. Ideally all frequencies, except for the resonant frequency, will die out in a very short time (20 milliseconds). The wire will continue to vibrate at the resonant frequency for some additional time. As it does so, it will cut the lines of flux in the plucking and pickup coil, inducing a voltage signal, with the wire's resonant frequency, to be feed back to the vibrating wire interface.
Until now, most vibrating-wire sensor's output readings were determined by measuring the time period required for a user specified number of cycles (usually 200 to 500). This measurement technique is susceptible to external noise. If the noise amplitude were within the range of the comparitor's measurement capabilities, the noise cycles would be averaged in with the resonant frequency cycles, leading to erroneous results. This is even more pointed for VW sensors whose signals have lower frequencies and amplitudes (some have signal amplitudes lower than 1 mV rms, which is below the level of some instruments' comparator capabilities). This lack of measurement integrity has been a concern for many of Campbell Scientific's customers. This led Campbell to investigate a new approach that uses spectral analysis to determine the wire's resonant frequency. This method improves noise immunity and allows for the measurement of lower-level signals.
Figure 2. Vibrating-Wire Interface Comparison
The new approach:
- Records the time-sampled response of the VW sensor using an analog-to-digital converter.
- Transforms the time response to a frequency spectrum.
- Interpolates the spectrum to determine the wire’s resonant frequency.
In the past it was deemed that, due to the large measurement and processing time required for a Fourier transform to resolve the required frequency resolution, Fourier analysis could not be used for VW measurements. The new approach, with its spectral interpolation scheme, solves this dilemma. The newly designed AVW200 interface excites the VW sensor, measures the response, performs a Fourier transform on the response, and returns the result with a resolution better than 0.001 hertz, all within two seconds. Because spectral analysis can distinguish signal from noise on the basis of frequency content, this technique offers improved immunity to competing noise. In a typical noise benchmark, spectral analysis frequency errors are less than ±0.02 percent of the reading. Compare this to frequency errors exceeding 100 percent of the reading using traditional time-domain methods. Spectral analysis also offers improved precision during quiet conditions, achieving a frequency precision of better than 1x10⁻³ rms hertz.
Figure 2 has plots of the response for two Geokon 4000 vibrating-wire sensors that were briefly subject to the same electromagnetic field at about 10:02 a.m. The sensor interfaced to the AV200 (new spectral analysis interface) is plotted against the left Y axis. The sensor interfaced to the AVW1 (old period-average measurement type) is plotted against the right Y axis. Both interfaces are wired to a single CR1000 datalogger. Both Y axes are scaled in hertz.
As can be seen from these plots, the AVW200 interface that uses spectral analysis is fairly immune to noise (output changes less than 0.01 hertz). The AVW1 interface, which uses the old measurement technique of period averaging, changes more than 3000 hertz. This shows the relative noise immunity of the new interface under extreme conditions. It should be noted that noise can affect the AVW1 (period averaging) anywhere from the extreme (as shown here) down to minute measurement errors. So in an electrically noisy environment, the amount of error introduced into the measurement, when using the old period-average technique, would always be an unknown.
The new approach not only eliminates noise concerns, but also provides diagnostic information on VW measurements including signal strength, signal-to-noise ratio, and signal-decay ratio. These diagnostics allow VW users to identify compromised measurements and monitor the long-term performance of their gages. Other advantages are ease of programming, low power consumption, multiplexer control, standalone operation, and optional wireless option.